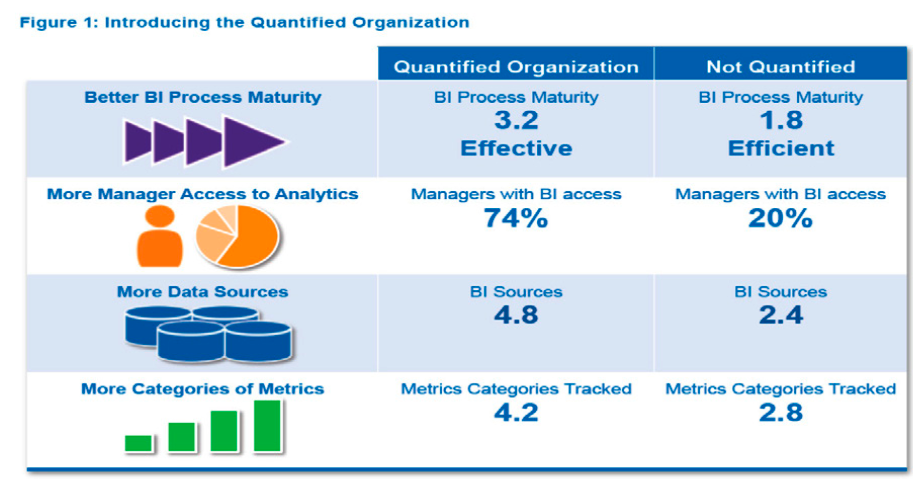
The challenges companies face today are like none before. The “great resignation” has heightened the war for talent, as attracting, retaining, rewarding, and developing the workforce has a direct effect on profitability. Managing rapid growth is key to a company’s success, and having a strong workforce goes a long way toward managing that growth. It’s no secret that people analytics leads to actionable insights into the workforce and positive business outcomes. The 2014-2015 Sierra-Cedar (now Sapient) HR Systems Survey identified the Quantified Organization1 – organizations whose business intelligence capabilities outperform other companies, which correlates strongly with financial performance. Yet well-meaning companies have expressed frustration about getting the intended results because of data issues. This article address- es those pain points and proposes a plan to resolve them.
The main point of pain is the need to have a consolidated view of the data in the organization. HRIS, Talent and Workforce management solutions can’t consolidate information for reporting or analytics unless they’re built on the same data model. As a result, reporting doesn’t offer a complete view of the organization. 2021’s Sapient HR Systems survey reports that on average, companies deploy 16 HR modules and 37 integrations – much more for larger companies. Therefore, it is likely there will be data sources that are “left out” of your analytics.
Some examples are:
• Quality of hire analysis involves information from the Talent Acquisition module, to map the source of the hire and interview process, and HRIS to track the employee’s performance and career progression on the job.
• Measuring the effectiveness of a Learning and Development program involves combining data from the LMS and HRIS.
• Workforce Planning involves forecasting demand for talent as well as financial projections. This may involve compensation, time & attendance, absence data as well as information from HRIS.
1: 2014-2015 Sierra-Cedar HR Systems Survey
Looking at only one data source is like the story of the blind men describing an elephant – it yields an incomplete picture of workforce trends and can lead to the wrong conclusions and actions by management. Sometimes, stakeholders run separate reports from each module then combine them on spreadsheets using Excel VLookups. This is a painstakingly manual process that is time-consuming, inconsistent, and prone to error.
Upon converting data for a new HRIS, several discoveries and questions arise. It is common to use the implementation as an opportunity to transform your data to a format that meets your company’s current and future needs. The data design in your old system may reflect the way the organization was years ago, but not as it is currently. Simply porting over the data as-is would just perpetuate some of the problems that caused you to acquire a new system in the first place.
Here are some examples of common anomalies that can hinder your effort to provide accurate analytics:
• Data needs to be transformed – upon converting data to a new HRIS, one client realized that they have 4,000 job codes defined for their 5,000 workers. Many can be combined and reorganized. Another client realized they had over 40 salary grades. Both need to be consolidated, but these transformations can be difficult and time consuming. They are usually done manually in spreadsheets, which are prone to error.
• Incorrect data – one example is that it was known that the locations for employees are not accurate. Locations were assigned correctly when the employee was hired, but as they transfer around the organization, the manager often fails to update the system. Therefore, reports on employees by location wouldn’t be accurate and may drive the wrong decisions.
• Historical data – when converting to a new HRIS, implementation vendors recommend converting only current employee information– not job history. The reason is that convert- ing more data is time consuming and costly. However, that historical information is needed for trend analysis reporting and data retention requirements.
• Reference or Master Data – sometimes data to drive analytics is needed but doesn’t fit in any system. These can be global hiring targets or data that was stored in customizations in your old on-premise system. All too often, these values end up being hard coded in programs or reports, causing a maintenance nightmare.
• Different organization structures for different processes – people who have worked with HR systems extensively know that there are many important relationships in an organization, not just the direct manager. Finance, learning, talent management, compensation are just a few examples. Keeping multiple structures in sync can quickly become an impossible task.
• Different key identifiers– your HRIS, Fi- nance, Benefits, Talent Acquisition and Payroll System may use different fields to identify each employee. Therefore, even if you had access to all these systems, consolidated reporting would be problematic without a mechanized process to link them up.
As we can see, there are challenges to getting all data in one place, cleaned up and associated to each other. Doing so is a pre-requisite to providing accurate and meaningful analytics. Luckily, technology solutions exist to address these issues.
Enter the Data Platform
Data Warehouses have been around a long time to serve the need of combining data sources for reporting or Business Intelligence (BI). Here are the steps involved in creating one for Human Resources:
• Integrations – data must be moved from the source system to the data warehouse. This can take the form of batch flat-file transfers. Usually, these integrations occur once daily (during the nightly batch window), as daily granularity is usually sufficient for people analytics, but can be run several times daily if needed. Many BI platforms also offer API web services protocols, for pulling live data from different source systems each time a report is generated. Since the platform is the hub of all activities, all integrations are bi-directional to/from the platform – there are no point-to-point integrations needed (data can be sent back to the source after transformation and clean-up).
• Extract-Transform-Load (ETL) – once the data is loaded into an area of the data warehouse in native format, an ETL program is run to move the data into the analytics database. Any transformations of the data would occur during this step. Also, this is the best time to fix erroneous data. This may entail HR Business Partners (HRBP’s) communicating with man- agers and employees to fix known issues.
• Normalized HR Data Model – usually, the data is loaded into a fully normalized structure (called a schema), that sets data relations and optimizes data integrity as the information changes. This involves the task of Data Analysts, who understand the HR data, working with Data Architects to map the source data into the target schema. Be aware that defining a master HR schema is a large task, as the resulting database will involve several hundred tables if done comprehensively.
• Master Data Management (MDM) – your HR solutions don’t have the same format. Oftentimes, the employee ID is the unique identifier from the HR system, but other modules, like Benefits, Payroll or Finance, may have a diverse set of identifiers. Master Data Management solves these issues by providing translations between systems, and seeing all HR data as a unified whole, while being able to translate the data to previous values. This is sometimes called Data Harmonization.
• Star Schema – once the data is stored in normalized format, it can be de-normalized into a structure that’s optimized for reporting. The data entities are separated into Fact tables and associated Dimensions. The diagram of this arrangement looks like a star, hence the term Star Schema. It is the Star Schema that’s exposed to Analytics tools.
The Move to the Cloud
On-premise Data Warehouses are complex to build and expensive to maintain. However, there are now Data Management platforms offered by the major cloud providers that offer several advantages. This puts data platforms within reach of companies that don’t have huge IT departments. Consider the following:
• Cost – modern cloud data platforms are a fraction of the cost to build and maintain compared to on premise data warehouses. The customer pays by the size of the dataset and the services used. This is due to the economies of scale for the cloud platform provider.
• Scalability – Cloud data platforms can scale quickly. Therefore, if you acquire another company and double your size, no new hardware or software is required. You will pay more, but not double.
• Security – Any cloud provider knows that their business is based on trust, and they are one data breach away from losing that trust which would be an existential threat. Cloud providers can afford to spend what it takes to have strong security (and can’t afford not to) – much more than most clients can afford for on-premise environments.
• Tool Sets – cloud data providers offer the tool sets you’ll need to administer your environment.
· Database Management System (DBMS) – you will need a DBMS. Some popular ones are Snowflake, Google Big Query, Oracle, MS SQL Server, and MySQL.
· ETL Language – Fivetran and Matillian are popular options.
· Data Lakes – Structured data is data found in databases with a pre-determined structure, such as HR applications. Unstructured data is data that exists on the web or in your environment that doesn’t fit into pre-deter- mined database structures, such as: text, email metadata, video, pictures, chat, etc. Machine learning depends on large datasets to train the algorithm. This usually consists of unstructured data. Having a data lake offers you the option to use machine learning to see patterns in the workforce that could not be observed by analyzing structured data.
• Data Security – the resulting analytics must be secured both with row-level security (who can see whose records), and field-level security (what data can they see). Often dashboards are grouped by the level of sensitive data and restricted to the appropriate audience. Row-level security can be implemented by importing the security tables from HRIS to drive who can see whom. If HRIS’s security definition is not appropriate, structures to administer security can be built and maintained in the data ware- house.

Some of the leading cloud data platform providers.
Why is it good?
We’ve talked a lot about technology, but how does the data platform help your business initiatives? Consider the following use cases:
• Mergers and Acquisitions – a merger or acquisition can look as daunting as the initial implementation, but if you’ve constructed your normalized HR data model and transformation rules, all the pieces are in place to make combining the two companies’ data a snap.
• Reorganizations – can be confusing and disruptive to an organization and may not yield the intended outcomes. With a data platform, both organizational structures can exist simultaneously, so you can gradually assess which structure works best for which process.
• Future Implementations – after implementing your HRIS, you will want to add more HR functionality. Adding new modules leverages the HR data model to export data to the new module.
• Trend analysis – data visualizations over time can provide insights into ongoing issues in the company. By storing history in the platform, you can spot trends and get to the root of the issue.
• Validating predictive algorithms – algorithms that predict outcomes, such as attrition, must be tested for their validity. The best way to do that is to run it against a period in the past and see if the predicted resignations occurred.
• Data retention –Jurisdictions have different regulations about data retention. To be compliant its best to maintain access to all the pertinent data.
• Reference Data– all those data values that aren’t stored in any of your systems, or that came from a customization in your old on-premise system, can find a home in the data platform. A simple app can be created so an authorized person can keep the data current. Thus, the platform can fill the gaps in your HR stack and ensure that all your data resides in a place where it can be easily accessed and maintained.
Getting Creative
The data platform offers a place for value- added apps that fills certain business needs:
• The multi-organizational capability mentioned earlier can support matrix management and the move toward organizational agility.
• Organizational Network Analysis (ONA) can see the important relationships in the organization that are not in your org structure. This depends on unstructured meta- data stored in the Data Lake and can yield insights into the hidden relationships in the company.
• The platform can, over time, get smarter about mapping source data to the HR data model.
• The Data Lake can be the platform by which you grow machine learning capabilities that can identify patterns in the workforce.
The possibilities are endless.
Analytics Options
Now that you’ve set up and optimized the data platform, you need to make the data available for strategic analytics. There are two options:
• Analytics provider – use an out-of-the- box analytics tool, such as Vizier, OneModel or Vemo. Hooking the data platform up to one of these tools will decrease your time to value and optimize your investment.
• Do it yourself – the Star Schema, with appropriate security access, can be attached to any BI tool that is used in your organization, such as Tableau, PowerBI or Looker.
Skills Needed
Everything described in this article requires specialized skills, but those skills can be acquired or developed. Here is a listing of the expertise you’ll need:
• Data Analysts – employees who know the data and can relate it to business needs. They are needed to help map the data from the source systems to the HR Data Model in the platform.
• Data Architects – design the HR Data Model, Star Schemas, and create ETL pro- grams to map and transform the data into those structures.
• Analytics Users/Subject Matter Experts – business people who use people analytics to drive strategic decisions.
• Integration Engineers – people who are familiar with the interface methods of the source systems and Data Warehouse. They build integrations to and from the platform.
While the Data Analysts and Analytics Users are typically employees of the company, the other roles can be filled by consultants with specialized skills.
Conclusion
A platform differs from an application in significant ways. An application determines (with some room for changes) how you will accomplish a process. Your HRIS, Talent and Work- force Management solutions are examples of this. A platform, on the other hand, gives you the tools you need to face the unanticipated challenges that will arise. Thus, the platform is what’s needed in today’s agile environment. If you want to glean the insights analytics can provide, you must get your arms around your data.
End Notes
1 2014-2015 Sierra-Cedar HR Systems Survey

