After creating predictive models for drivers of so many HR outcomes in the past 20+ years, there is one fundamental truth that has stood the test of time. The most actionable models require as much art as they do science.
Earlier in our careers in people analytics, we were preoccupied by creating the “best possible” predictions. After all, organizations were asking us where their greatest risks were in hiring, engaging, developing, promoting and retaining talent. What would be more important than the accuracy of those predictions?
Here’s the problem. Generally, albeit not always, the best predictions may not provide sufficient insight to act in a way that allows an organization to change the ultimate outcome.
As a practical example, three common variables driving an outcome like turnover tend to be age, tenure with an organization and career, or pay, level. The more experience someone has with an organization or in their career overall and the more advanced they are professionally, the less likely they are to leave. Of course, we all can think of exceptions to these general patterns, but they are general patterns, nonetheless. As such, we inevitably see these variables as factors driving turnover—recognizing that there can be intercorrelations between these variables in some organizations and situations. That said, these factors typically are not the most actionable from an intervention perspective. We cannot alter someone’s age, for example, although perhaps we have new opportunities for speeding up the aging process in the future with the potential advent of commercial space travel (as there has been some research to suggest that it accelerates aging!)?
All kidding aside (or perhaps not?), the more actionable variables in many statistical models predicting workforce outcomes from an organizational standpoint tend to be less about the individual and more about the teams and organizational structures within which they work.
Think about your organization. When teams get too large, do employees have less support? When there is less promotional opportunity due to the embedded hierarchy or lack of internal movement, is there an unintended perception that it is easier to be successful by leaving your organization? Even if there is promotional opportunity, is there a perception that it is easier to change roles externally vs. internally?
These are but a few examples of team and organizational factors that could impact predictive models in HR for which we potentially could take action. We might categorize these variables as more of the “art” of predictive analytics, since they tend to be derived from the individual-level, or raw, data vs. representative of the raw data itself, which might be more traditionally characterized as the pure “science” of prediction.
As an example, a span of control is a variable that could be calculated and “attached” to the data for both the manager (or “owner” of that span) and the team member (or “participant” in that span). We then can create a statistical model to see the consequences of spans of control on both the owner and the participant. If negative consequences are found when our spans of control are too large (for the owner, the participant, or both), we could consider redefining teams. Now, you could argue: Making spans of control smaller may increase organizational costs. And, you could be right, depending on how these interventions were enacted and the financial effect of any cost implications after accounting for the benefit of any productivity, performance and turnover differentials. While there certainly is a Return on Investment (ROI) that needs to be considered carefully when evaluating any action, the key is to identify impactful actions vs. predictive factors in and of themselves.
Just as art can be both presented and interpreted in vastly different ways by different audiences, so too can the fundamental definition of success vary from organization to organization. Or, what might be deemed actionable in one organization might not hold for another organization in the same way.
As a case in point, we asked Wendy Hirsch, Vice President – HR Technology, Analytics and Services, at Eaton Corporation for how art-and-science has played out in their predictive modeling efforts. Here’s a recent use case that she shared:
As the unpredictable year of 2020 came to a close, the leadership team of one of Eaton’s industrial products divisions was concerned about potential pent-up voluntary turnover among salaried employees. With historically-low voluntary turnover in 2020, business leaders were looking to avoid a rise in turnover costs and lost productivity, if attrition were to return to pre-pandemic levels. Working with the business, Wendy’s team undertook an effort to identify the drivers of voluntary turnover to support actions to maintain the division’s newfound, lower voluntary attrition rate.
While the remit was to apply a scientific approach to uncover the predictors of turnover, Wendy knew that the power was in embedding a combination of both art and science in every process step:
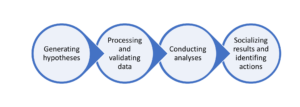
- • Generating hypotheses: Engaging with leaders in the business up-front established hypotheses of what they thought drove people to quit. Their assumptions, anecdotes and perceptions were important inputs into what data might be worth collecting and what statistical models to run. For example, conjectures around work overload and financial uncertainty led to additional data collection beyond the core Human Resource Information System. Part of the art was in finding both ways to collect these data and creating data proxies to test the theories presented by leaders.
- • Processing and validating data: Applying expert, “artful” judgment is critical to managing how much and what types of data need to be collected. For example, several labor market variables (e.g., purchasing power and quality of life indicators, distance to work, and unemployment rates) were not identified as ultimately adding value to Eaton’s model statistically, but they were important to include because they showed leaders that these external factors were considered and evaluated as part of the process.
- • Conducting analyses: Identifying drivers of people’s choices to stay or leave through statistical modeling was only part of the story. The team also examined what employees said were their reasons for leaving. Employees’ perceptions and intentions (yet another form of “art”) were gathered through surveys and focus groups and informed the statistical model development (the “science”). Through this work, the team discovered that more than 50% of exited employees indicated a lack of resources as a primary reason for leaving. This insight was used to establish variables to test how turnover, leave of absences, spans of control and the like impacted an employee’s turnover likelihood.
- • Socializing results and identifying actions: Applying “art” in this step may make the die-hard statistical gurus cringe, but the importance of ensuring that the results can be consumed and used by business leaders cannot be understated—even if it may mean sacrificing statistical integrity along the way. For example, the team had three variables that served as different proxies for recognition and found that all three significantly decreased an employee’s likelihood of quitting by 20% or more. When messaging the results to senior leaders, these effects were artfully “blended”, which allowed business leaders to focus on the directional theme and determine the best course of action vs. focusing on the nuances of the analytic output.
Fast forward to the middle of 2021. What happened? At a time when workers are quitting in record rates and it’s difficult to find qualified talent, Eaton has been able to leverage the insights from this predictive turnover modeling work to ensure that this division (and others) have been able to manage and address issues to retain talent and reduce Eaton’s exposure to changing market conditions.
When considering the Eaton case study and other organizations that have conducted similar studies, there are generally three common themes:
- • One size does not fit all: While you often can make strong predictions at an organizational level, they tend to be too generic to be useful. What “works” for an R&D group might not be palatable for a sales function and what might be important in a manufacturing operation might not even apply to an IT group. If we only reflect factors that are relevant systemically, we miss the nuances that represent the strokes of the artist’s brush. At Eaton, Wendy and her team engaged leaders early on to ensure a keen understanding of potentially unique drivers to be considered when building a predictive analytics approach.
- • Looking from the outside in: There is an inclination to leverage market data to inform an organization’s internal predictive model. These factors sometimes provide insights that, once identified, could represent leading indicators of a future change in pay, performance, retention, etc. For example, what are the impacts of changes in industry-specific stock market performance, consumer goods costs and local unemployment rates on people outcomes within an organization? That said, we also have to ask ourselves to what degree are we able to act on these predictive drivers, beyond appreciating the “advance warning” of an impending change? While the Eaton team leveraged external data to inform their predictions, like many, they found that these factors only told part of the story and weren’t always key to predicting or acting on the ultimate outcome of turnover.
- • Less is more: Analytics professionals, especially earlier in their careers, have a tendency to want to put as many factors in a predictive model as possible—taking the view that more factors make for better, more “interesting” results. The reality is that, more often than not, these additional factors confound the model and potentially encourage organizations to focus on factors that will not have a substantive impact, albeit statistically significant. At their core, they do not change the overall predictive value of the model and are essentially an overfitting dilemma that we see too often when reviewing models developed based on the “science vs. art” of data analysis. At Eaton, the “less is more” mantra manifested itself in a different form—presenting model findings based on an artfully-combined, storytelling approach vs. a purely statistical mindset.
When looking at the people analytics efforts in your own organization, no matter how far you are in your journey with predictive analytics, there are opportunities to take advantage of “art” along the way:
- • Just getting started: Haven’t done a predictive model but really want a proof of concept? Rather than follow the philosophy that more data are better (so “let’s look at a research question that can be applied to the whole organization”), consider a more narrowly defined and specific research question for which you have some fundamental data, where you can help your business predict and “move” an outcome.
- • Tried and failed: If you’ve attempted to tackle a predictive model and have struggled, take another look to see if perhaps there is an opportunity to rethink the question, the data elements, etc., to reshape and reinvigorate your efforts, using a more artful approach.
- • Tried, succeeded but didn’t gain traction: We’ve seen this scenario play out a lot, where there is a working model, leaders seem engaged, but nothing happens as a result. What went wrong? Never underestimate the need for, and power of, pushing beyond the analytics. Leaders tend to struggle to translate predictive model outcomes to action. Even when we think these actions are obvious, we need to help leaders build a path forward. If you don’t feel that you have the expertise or influence to support that process, consider whether you have partners within or outside HR who can help bring your models to life—just as art is designed to bring some emotion to the surface.
- • Tried, succeeded and embedded in the organizational DNA: Consider the opportunity to share your learnings and experience with those who have less experience, as we look to build the people analytics community of experts. You know how long it took you to create your own perspective, help others develop their own techniques and artistic license.
We think of art as something that is somewhat elusive and interpreted “in the eyes of the beholder”. Likewise, people analytics is made more powerful by the unique perspective, data considerations and actions that are driven ultimately by individuals and not just manifested from a system or process. We, as humans, influence art and we influence the science of people analytics. With every data element, technique, and the like, we have an opportunity to help leaders see the beauty in their workforce and the opportunity of what could be!


