The Covid-19 pandemic brought major change and upheaval to work and personal lives. But another major change in 2020 and 2021 has been the increasing push to prioritize Diversity, Equity, and Inclusion (DEI) in the workplace. Diversity, Equity, and Inclusion (DEI) is certainly not a new concept in the world of business. For many, the racial justice protests in 2020 shined a bright light on existing racial and gender inequities in society and highlighted the need to improve transparency and drive change with respect to how DEI is addressed in society and work.
A January 2021 study by JUST Capital JUST Capital corporate-racial-equity-tracker, found large companies getting the diversity message. JUST Capital’s Corporate Racial Equity Tracker, which gathers DEI data disclosed by the 100 largest employers in the Russell 1000, shows investors how companies are doing on their diversity, equity, and inclusion commitments. According to JUST Capital “While only 45% of those 100 companies disclosed such data in 2019, that increased to 80% just two years later”.
Diversity Matters Financially – A 2018 white paper “Delivering through Diversity delivering-through-diversity” by McKinsey and Co. as well as their 2015 study “Why diversity matters why-diversity-matters”, showed how much gender diversity matters in company performance, with gender-diverse companies performing 21% better than the national average. The study also found that ethnically and racially diverse companies had 43% higher profits.
From a progress standpoint, the issues with diversity and equity are most obvious at senior levels in organizations. The higher one ascends in a company, the more precipitously diversity drops off, which in turn results in less pay equity and inclusion.
Most companies would say that there are simply too few fully qualified diverse candidates for the most senior roles in their organization and industry overall. However, is that true or just an excuse? This is where analytics comes into play. Using analytics and publicly available data such as the Bureau of Labor Statistics and U.S. Census data from 2020, we can verify by geography and job type what the diversity level is by geo metro area and job type (U.S. Census has 100 job types and BLS nearly 900).
Using U.S. Census data from 2020 a given job family in a particular geo-metro area can tested and benchmarked to verify whether or not companies are stating the truth or simply doing a terrible job of recruiting/retaining diverse talent.
For example; 2020 U.S. Census data for the working population at the support staff and operations level (lower level lower skilled jobs), shows that racial demographics in the workplace most closely match U.S. demographics overall with the exception of Latinx individuals making up 10% of this workforce tier compared to 18.5% of the general population. Therefore, at lower levels of many organizations and industries, employment does closely match the U.S. overall.
Then what is preventing greater levels of diversity at higher levels in organizations?
As we move up in terms of skills and education in the U.S., the percentage of white staff increases steadily at each level of the corporate ladder, finally representing 85% of executives at topmost levels. At the executive level racial inequity is particularly significant: though 13.4% of the total US population is Black, only 2% of executives are Black; 18.5% of the U.S. population is Latinx, but only 3% of executives are Latinx. This data illustrates the fact that DEI inequality is deeply embedded in the business world.
This does not mean that greater balance in DEI is impossible to achieve. Rather DEI is a clear example of “…what is not well measured (or reported) is not well managed”. Structural workforce DEI inequity cannot be rectified unless organizations are not only deliberate and committed, but deeply analytical in identifying and removing structural roadblocks to greater diversity, equity, and inclusion.
According to a study titled “Goals and Targets for Diversity, Equity, and Inclusion” by Iris Bohnet & Siri Chilazi, published April 2020, in Harvard Business Review (HBR), there are some simple steps companies can take to achieve significant progress in reasonable timeframes
1. Present diversity data in a way that is simple, salient, and comparable.
All data are not created equal: To be actionable, and to impact behavior, data must be transformed into intelligence and insight in a clear concise “IF this, THEN that” simple logical flow.
Most companies have all the right data — more-or-less — at their fingertips, but lack insight into how best to organize the data and are usually blind to the predictive drivers of continuing inequity obstacles across the organization. Transaction counts and other employee information sitting passively in an HR dataset will not solve anything and will only continue to highlight the past, not predict/change the future. Executives notoriously don’t like bad news, so simple programmatic changes that fail to show progress may actually stop the program and/or reporting due to lack of quick-fix progress.
For example, virtually every company trying to improve diversity has tried and often succeeded at recruiting more diverse hiring classes than ever before. And yet fast forward three to five years and the overall diversity rate has barely budged, turnover of diverse employees is well above overall rates and diversity levels in first line managers/supervisors are essentially unchanged. What happened?
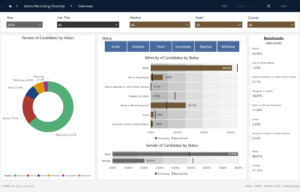
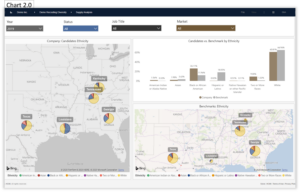
It is the hard work worth doing to analyze and identify key DEI drivers (aka KPI’s), then present them in an easy-to-understand, dynamic, customizable scorecard/dashboard. The dashboard should highlight what works and what doesn’t and enables management and HR to ask better questions. It facilitates the modelling of different possible futures using key DEI KPI driver metrics such as hiring, promotions, transfers, retention, engagement, and more, all of which is benchmarked to identify hotspots of ongoing success and failure. The data presentation must enable easy comparisons by job, geography, year, tenure, and performance level, to name just a few key dimensions (see Chart 1.0 and Chart 2.0).
For example, in the HBR article by Bohnet & Chilazi, the London Organizing Committee of the 2012 Olympic and Paralympic Games (LOCOG) used the simple, transparent, comparable approach to embark on a rapid, 200,000-person hiring initiatives. It extended the collection and reporting of diversity data to its own organization, as well as contractors, consultants, secondees, and sub-contractors involved in the Games.
All staff had access to a monthly topline snapshot of the organization’s diversity metrics across seven dimensions, including gender and gender identity, disability, ethnicity, and socioeconomic status, while senior leaders received detailed monthly reports broken down by department. The diversity data were presented alongside recruitment targets based on the relevant labor market. Each department was benchmarked, and each functional area ranked on their hiring record every month. This allowed the LOCOG team to identify patterns early and to intervene swiftly in the face of irregularities. Ultimately, the LOCOG organizers achieved or surpassed all diversity targets with 46% women, 40% ethnic minorities, and 9% people with disabilities in the Games workforce.
2. Leverage diversity data to empower the right people to act.
Leveraging diversity data to empower decisions or action is perennially easy to say but hard to do. What data is to be leveraged and how? What action is needed or should be taken. As stated in the Bohnet & Chilazi HBR article example of the LOCOG, the data was widely shared and any shortfalls versus goals were visible to all, which made taking action not only easier but absolutely required for managing organizers to retain credibility. When everyone can see how an organization is doing and where it is clearly failing to improve, the argument for action is clear and compelling. Management does not want to be seen as failing or worse, failing to improve results. Historically, this may explain why publicly listed companies have held DEI data so confidentially and declined to disclose DEI metrics both inside the company and externally to investors and markets. On the other hand, sharing such data proactively can create a greater sense of shared purpose and broad-based desire to improve across the board – exactly what many companies need.
Examples of DEI analytics include the use of predictive analytics modeling to trend and predict an organization’s future diversity and pay equity levels one, three and even five years into the future based on a set of assumptions around hiring, terminations, promotions, and pay practices. The simplest way to build such a forecast is simply to trend existing DEI program intervention changes in those same metrics in hiring, promoting, and paying the workforce to see how much diversity, equity and inclusion metrics change over time.
Chart 1.0 below shows an advanced analytic dashboard from an analytics solution for a retail organization with unique ‘store’ locations across the US. In this analysis, store locations are concentrated in the US South. The dashboard integrates data across more than 5 top dimensions (shown across dashboard top), segmenting recruiting candidates by ethnicity and recruiting status in charts, and compares versus local geography ethnicity levels (see black line | shown for each ethnicity category).

Such a dashboard can show HR and business leadership at a glance how they are doing in terms of recruiting greater levels of diverse candidates that effectively match the local community in which the store(s) operate, and if not, where in the application recruitment process candidates or even new hires are dropping out.
Chart 2.0 below clearly shows diversity recruiting effectiveness across several key southern US states. With any selected state, region or individual location’s diversity recruiting flow showing up in the top right chart “Candidates vs. Benchmark by Ethnicity,” managers and HR can see how they are doing at a glance by region and then drill down into state and individual location to find ‘best’ and ‘worst’ performing locations. Best locations could then be rewarded and asked to share their best practices whereas worst location store managers might be paired with best store managers to learn how more tips and tricks for attracting, onboarding, and retaining diverse talent.

Lastly, John Rice, a prominent DEI expert and founder of Management Leadership for Tomorrow, a nonprofit focused on systemic inequality and empowering the next generation of leaders, notes in a two part study “The Gap Between Minority Experience & White Perceptions of Racism at Work” (https://mlt.org/blog/author/john-rice/) that there are five important hallmarks of strong DEI policy:
- Recruitment and ongoing retention policies that focus on representation at every level
- Careful assessment of pay gaps based on data, and policy for rectifying gaps in earnings
- Commitment by top executives to creating an actively anti-racist workplace
- Company policies and business practice based on racial justice that are value driven, and not simply virtue signaling
- Philanthropic contributions to causes rooted in racial equity and justice
Despite the many challenges in the labor market today, DEI will play an increasingly important role for companies in coming years. This is not only due to the recent increase in DEI disclosure transparency for public listed companies, but also because of the business case showing that a more diverse workforce leads to higher human capital productivity and innovation. To become better, companies need an intuitive, holistic, and rigorous way to track DEI KPIs, make relevant reports transparent to managers, and spotlight issues for action and opportunities for improvement. Human Capital analytics is the right tool at the right time to help struggling organizations manage the complexity and sensitivity of DEI data for insight, change and a more diverse, equitable, inclusive workforce.


